Compass Decision Support
A compass that improves decision-making.
The “Compass Decision Support” BI dashboard is a revolutionary Business Intelligence tool designed by Avedian to be the compass that guides users in data-driven decision-making, allowing them to efficiently identify opportunities, risks, and areas for improvement in their organizations or clinical processes. This visual and intuitive tool facilitates interaction with the results of an artificial intelligence model that predicts critical variables such as length of stay, DRG, morbidity risk, severity, estimated costs, and percentage of expected complications. By leveraging these predictive insights, healthcare institutions can optimize resources and improve patient care.
Purpose: Key Metrics
The purpose of “Compass Decision Support” is to provide users with key metrics, trends, and predictive analytics updated in real-time, enabling strategic decision-making with confidence and speed. It facilitates the identification of risks and opportunities, improving the quality of care and operational efficiency.
Challenges and needs
Hospitals and healthcare organizations face multiple challenges in data management and analysis. “Compass Decision Support” was designed to solve these key problems:
- Data integration: It integrates data from multiple sources, providing a unified view and facilitating decision-making based on consolidated information.
- Access to real-time information: The dashboard is updated twice a day, ensuring that decisions are based on fresh and current data.
- Agile decision-making: It quickly identifies critical areas such as patients with prolonged stays, allowing for early and effective action, improving operational indicators such as bed turnover.
Problems Reported by Clients
Clients face difficulties that “Compass Decision Support” effectively solves:
- Data fragmentation: The lack of integration between different systems and sources complicates access to and management of information.
- Lack of real-time information: Many organizations work with historical data, which limits the capacity for rapid response.
- Bed turnover optimization: The need to increase bed rotation to improve hospital response capacity and reduce waiting times.
Key Benefits provided by CDS
- Improved efficiency in bed utilization.
- Reduction of operational costs.
- Anticipation of clinical complications.
- Optimization in resource and personnel planning.
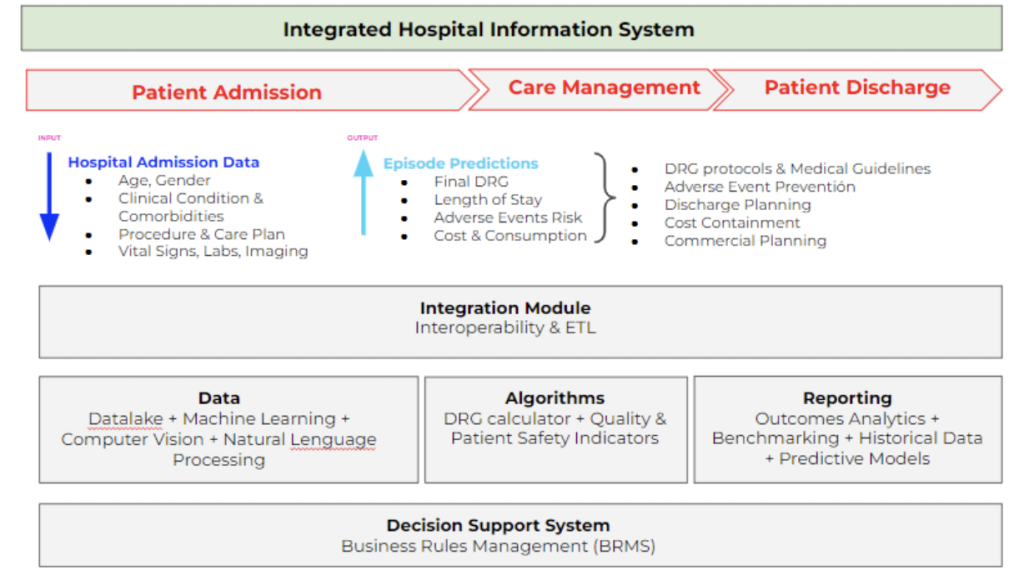
Architecture
The tool is based on a three-stage architecture:
1.Data loading: Data is collected and unified from different sources.
2.Transformation: The data is processed using machine learning algorithms.
3.Publication: The results are presented on the BI dashboard for analysis.
The processed data is stored in a Data Warehouse, while the artificial intelligence model is responsible for analyzing historical data and generating predictions. The BI dashboard visualizes the results, allowing users to interact with them.